Monitor your Infrastructure with TIG Stack

I was looking for a way to monitor my host and Docker containers and found TIG (Telegraf + InfluxDB + Grafana) to be a great solution, not because the name of the stack, but because it was free, open-source and lightweight.
Grafana is also a good option because it can be used to make dashboards for anything, and I'm interested in making one for my business to track some KPIs.
First of all, Telegraf will collect the data based on input plugins and export them to output plugins (InfluxDB) in our case.
docker run --rm telegraf -sample-config > telegraf.conf
And we have the base telegraf.conf file.
What we are looking for is to enable (uncomment)[[outputs.influxdb]] and urls = ["http://influxdb:8086"] so Telegraf knows where to output everything.
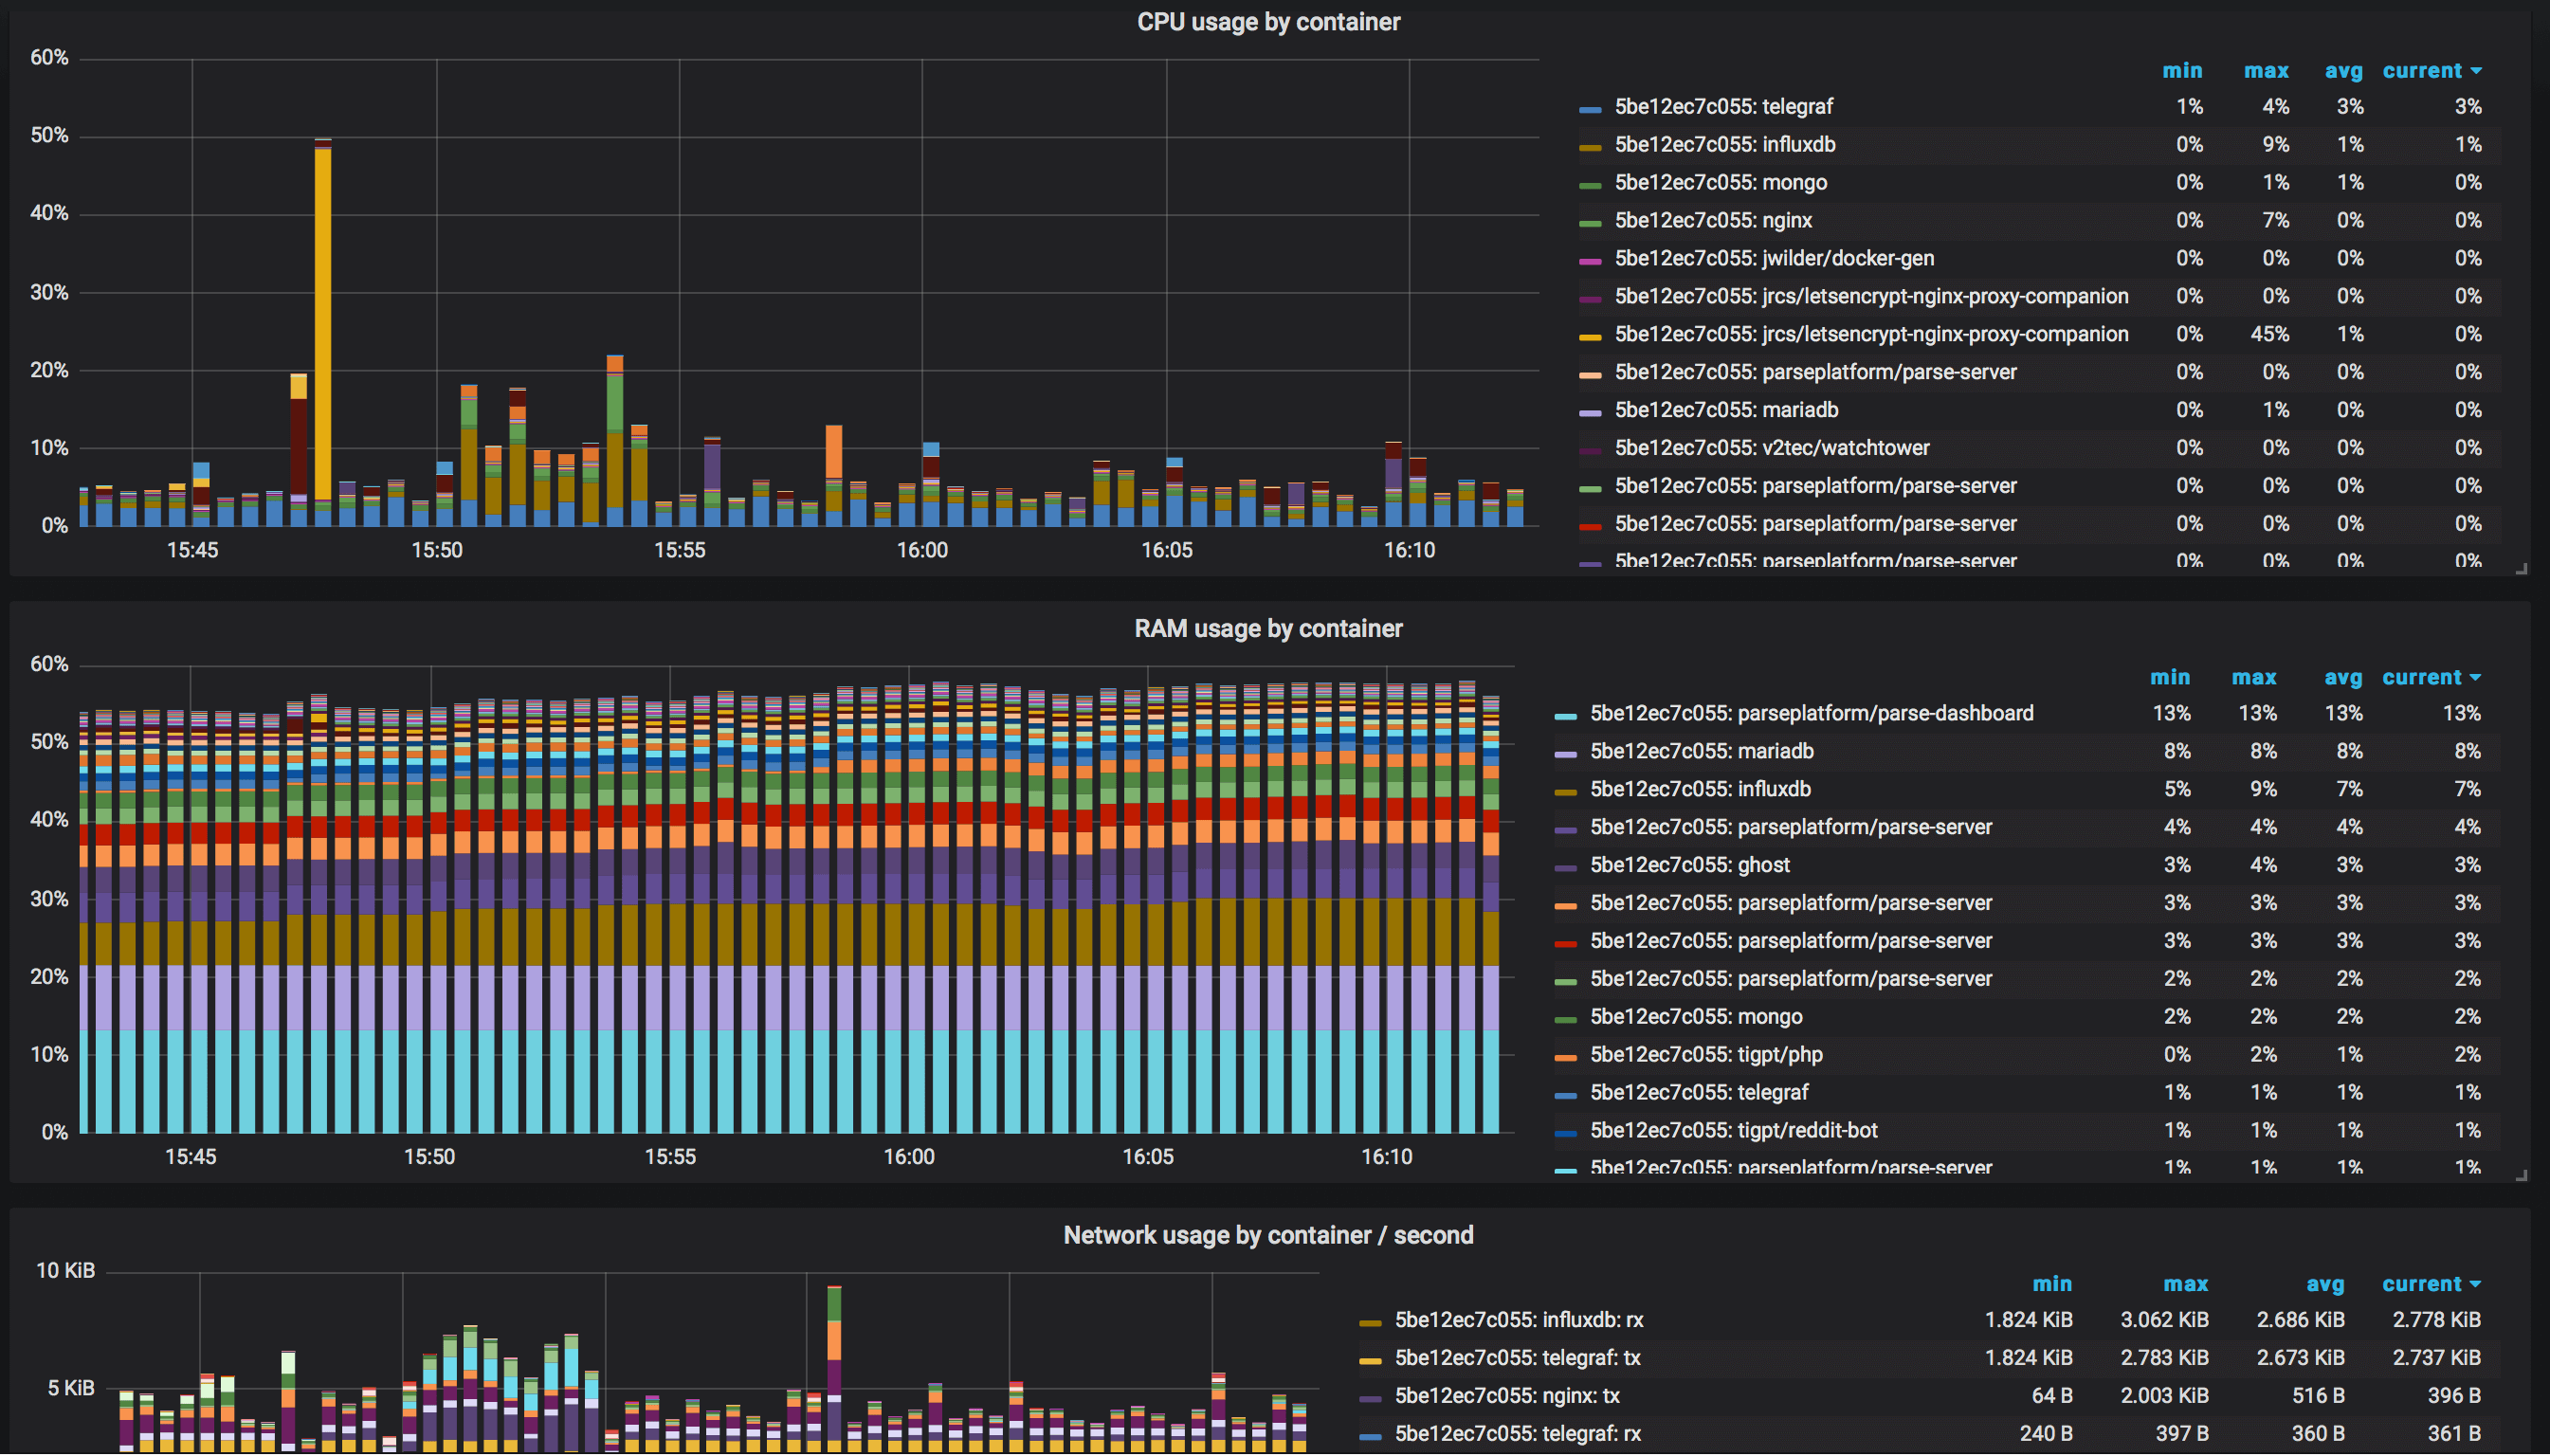
You can leave it as it is to monitor your host, but since we are running this on docker, it makes sense to monitor docker as well.
[[inputs.docker]]
endpoint = "unix:///var/run/docker.sock"
If you use other technologies like nginx, mongodb, mysql and so on, you can dig into that later by setting all inputs.
Save and Quit and you have your telegraf.conf ready.
We need to start our docker-compose and for telegraf service, it will look something like this (don't forget to link to influxdb to save data).
  telegraf:
      restart: unless-stopped
      image: telegraf:1.7-alpine
      links:
        - influxdb:influxdb
      volumes:
        - ./telegraf.conf:/etc/telegraf/telegraf.conf:ro
        - /var/run/utmp:/var/run/utmp:ro
        - /var/run/docker.sock:/var/run/docker.sock:ro
        - /sys:/rootfs/sys:ro
        - /proc:/rootfs/proc:ro
        - /etc:/rootfs/etc:ro
      environment:
        - HOST_PROC=/rootfs/proc
        - HOST_SYS=/rootfs/sys
        - HOST_ETC=/rootfs/etc
InfluxDB will make our data persistence and will feed Grafana with information.
    influxdb:
      restart: unless-stopped
      image: influxdb:1.5-alpine
      volumes:
        - ./influxdb/:/var/lib/influxdb
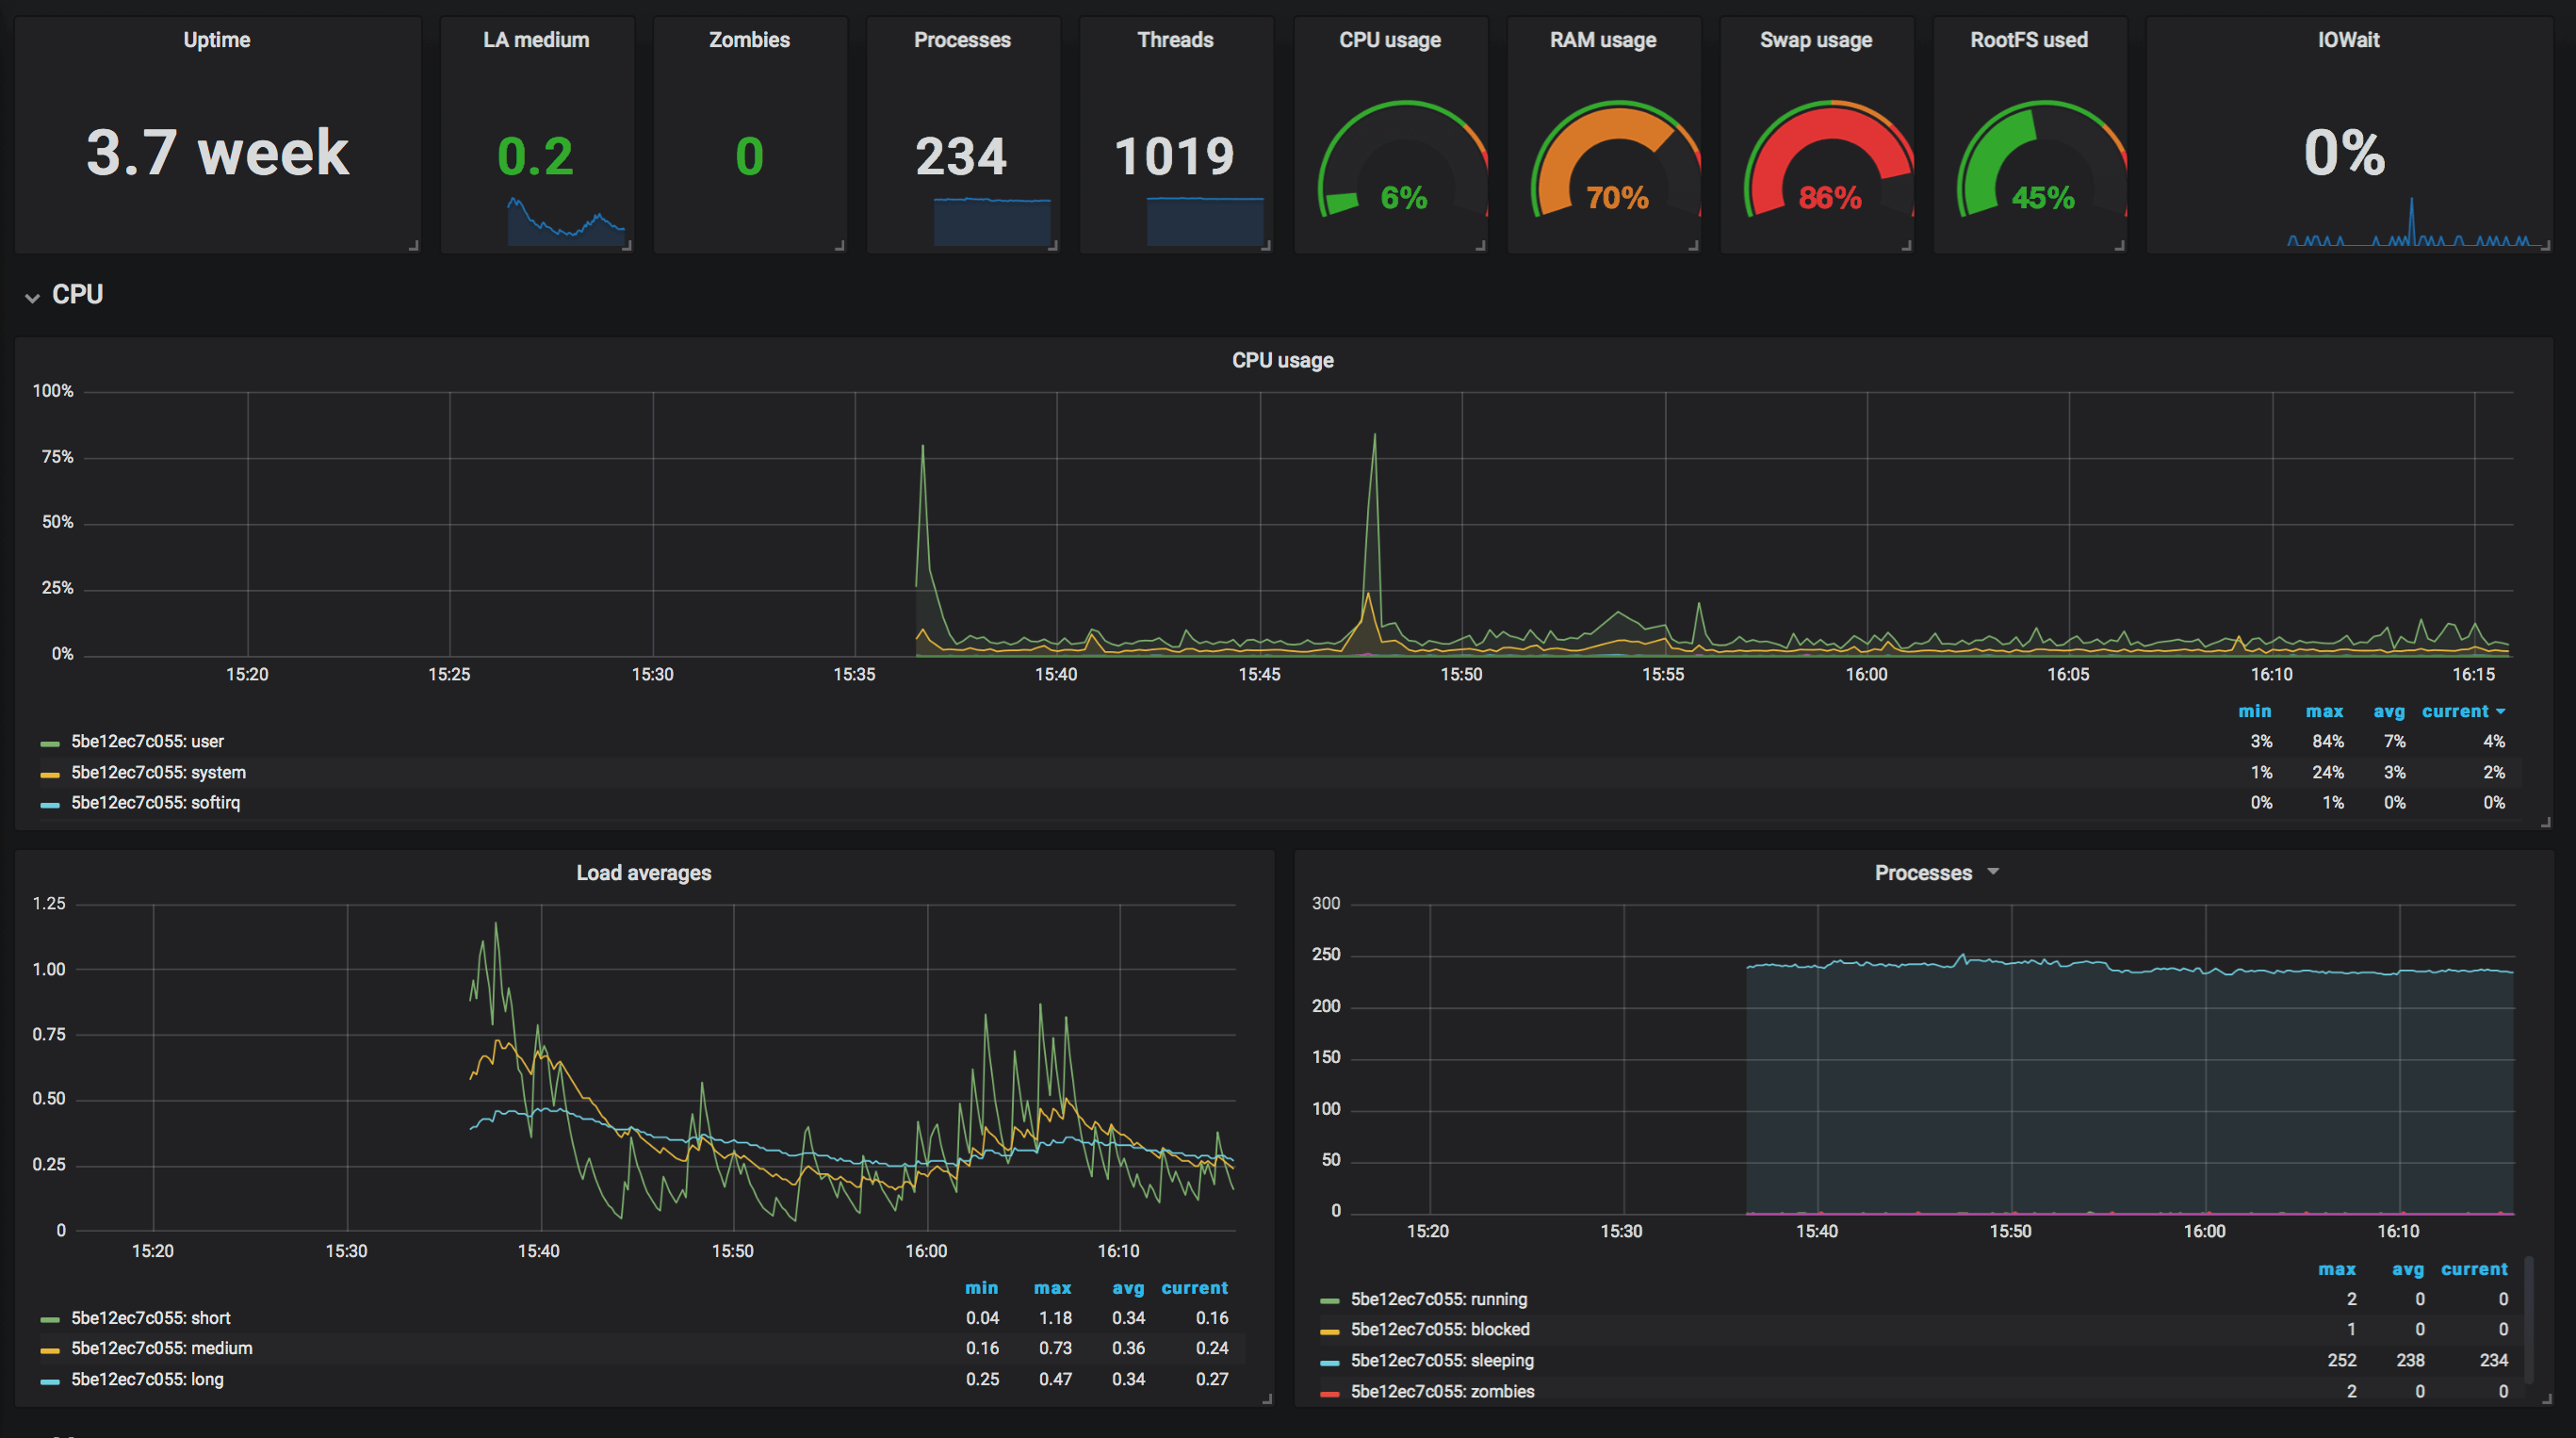
Grafana will be your frontend and connect to influxdb to get all your precious data and do its magic to make a beautiful, and useful dashboard.
    grafana:
      restart: unless-stopped
      image: grafana/grafana:5.1.0
      links:
        - influxdb:influxdb
      volumes:
        - ./grafana/:/var/lib/grafana
      environment:
        - VIRTUAL_HOST=${DOMAIN}
        - VIRTUAL_PORT=3000
        - LETSENCRYPT_HOST=${DOMAIN}
        - LETSENCRYPT_EMAIL=your@email.com
        - GF_SERVER_ROOT_URL=https://${DOMAIN}
        - GF_SECURITY_ADMIN_USER=your@email.com
        - GF_SECURITY_ADMIN_PASSWORD=your_secret_password
I had to chmod -R 777 influxdb and grafana folders so it can easily create all needed files for databases and configs.
After login in Grafana, add your data source http://influxdb:8086 with database name telegraf and user root and password root.
Take a look at what you can do with Grafana at Grafana Demo.